The Structure Database
The genetic structure of the whole germplasm collection was evaluated using STRUCTURE software. The analysis provided evidence for a significant population Structure in this set of tomato ecotypes. A maximum value of the rate of change in the log probability of the data was revealed at K = 9, using Evanno’s method. The estimated logarithm of probability of the data [L(K)] increased linearly up to K= 9. The highest Delta K value was observed at K = 9. The estimated population Structure inferred from the analysis identifies nine genetic groups (ancestry groups A, B, C… to I) and is graphically presented in Fig. 1, along with the distribution of each ecotype in the ancestor population that they belong according to the analysis.
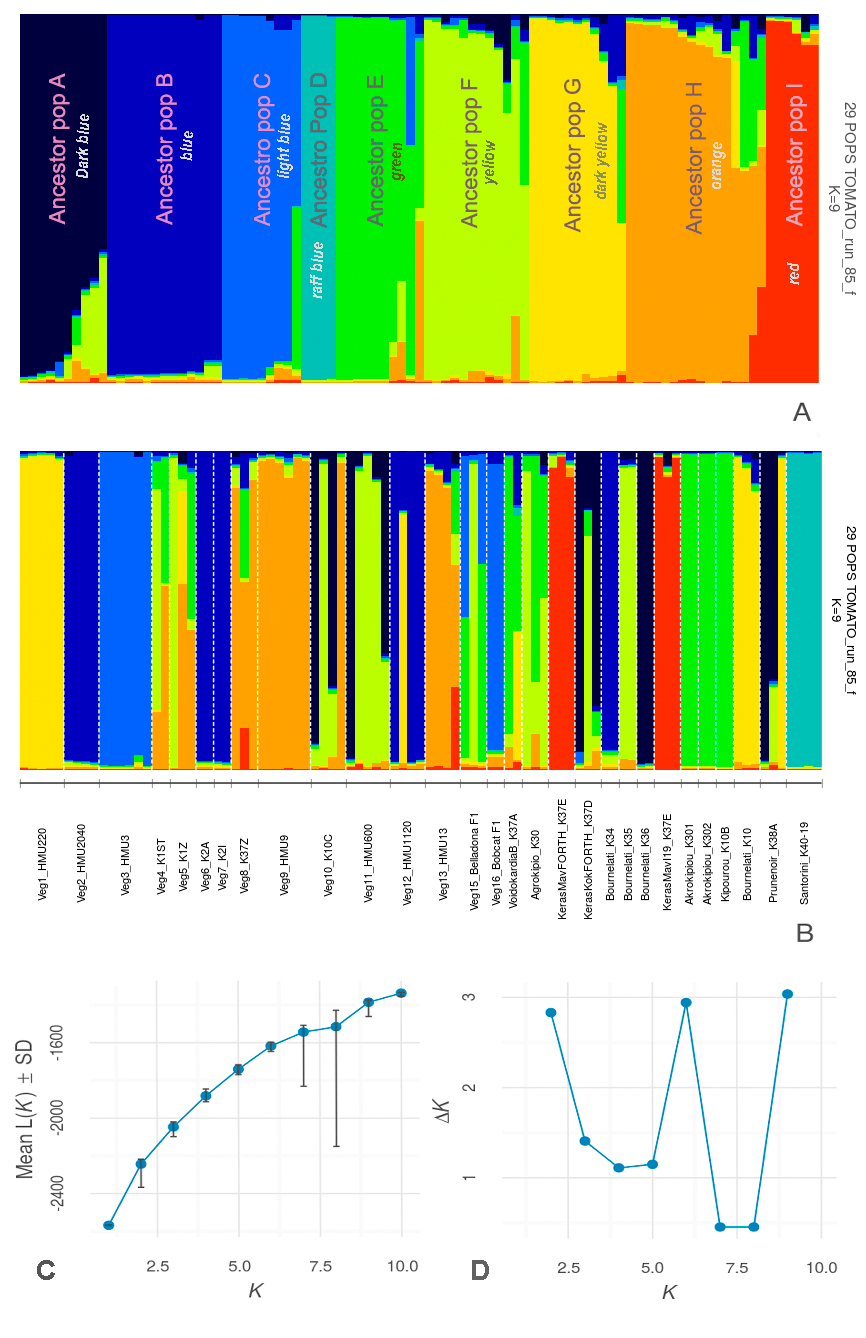
Fig. 1. Genetic STRUCTURE of twenty-seven tomato-landraces and two tomato-hybrids from Greece with 11 SSR considering K=9. A) Colors represent the nine groups, defined by the K value. The vertical axis indicates the resulted ancestry groups A, B, C, to I, for each genotype. B) The distribution of each ecotype in the ancestor population that they belong according to the analysis. C) Mean (± standard deviation) log-likelihood value of the data [L(K)] as a function of the value of K, the number of clusters, D) second-order rate of change of the log-likelihood of the data (ΔK) as a function of K, the number of clusters